


Let’s talk about data. How it’s captured, stored, and analysed.
My Home Assistant hub is now starting to gather very basic data. Although, I can be assured the volume of data will increase as future sensors and devices are installed. So this got me thinking about tracking other data such as energy consumption, which eventually turned into thoughts on the best methods for its storage and analysis.
Let’s start with the energy monitoring component.
Open Energy Monitor
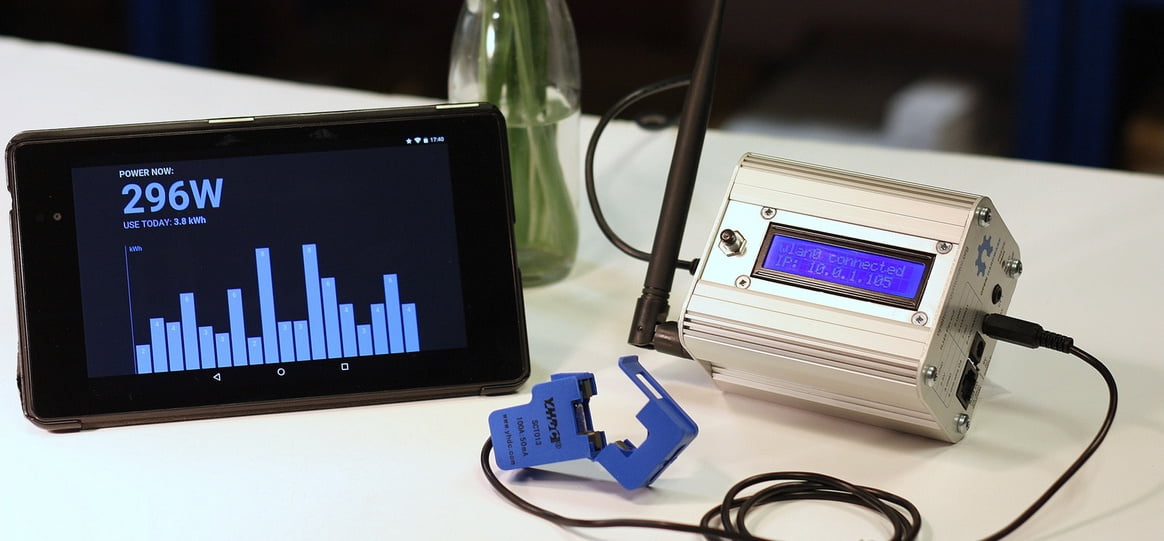
On the Home Assistant components page I came across EmonCMS. EmonCMS is part of Open Energy Monitor, a supplier of extremely affordable hardware and software. And like Home Assistant, Open Energy Monitor is also open source.
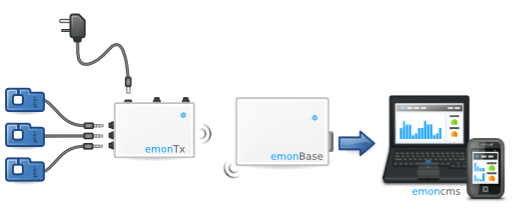
The Open Energy Monitor hardware components are relatively simple. The sensors which monitor the current clip onto the mains power cables. The sensors plug into the EmonTx transmitter, which then wirelessly transmits data to the EmonBase. It’s an easy setup which doesn’t require wiring directly into the mains power.
The EmonBase unit stores the data locally in EmonCMS for viewing and analysis, but can optionally be sent to an external source (i.e. cloud) of EmonCMS. The EmonCMS data can also be sent to Home Assistant. Not that Home assistant can do much with interpreting the data, but I’ll explain the reason for why I might do this shortly.
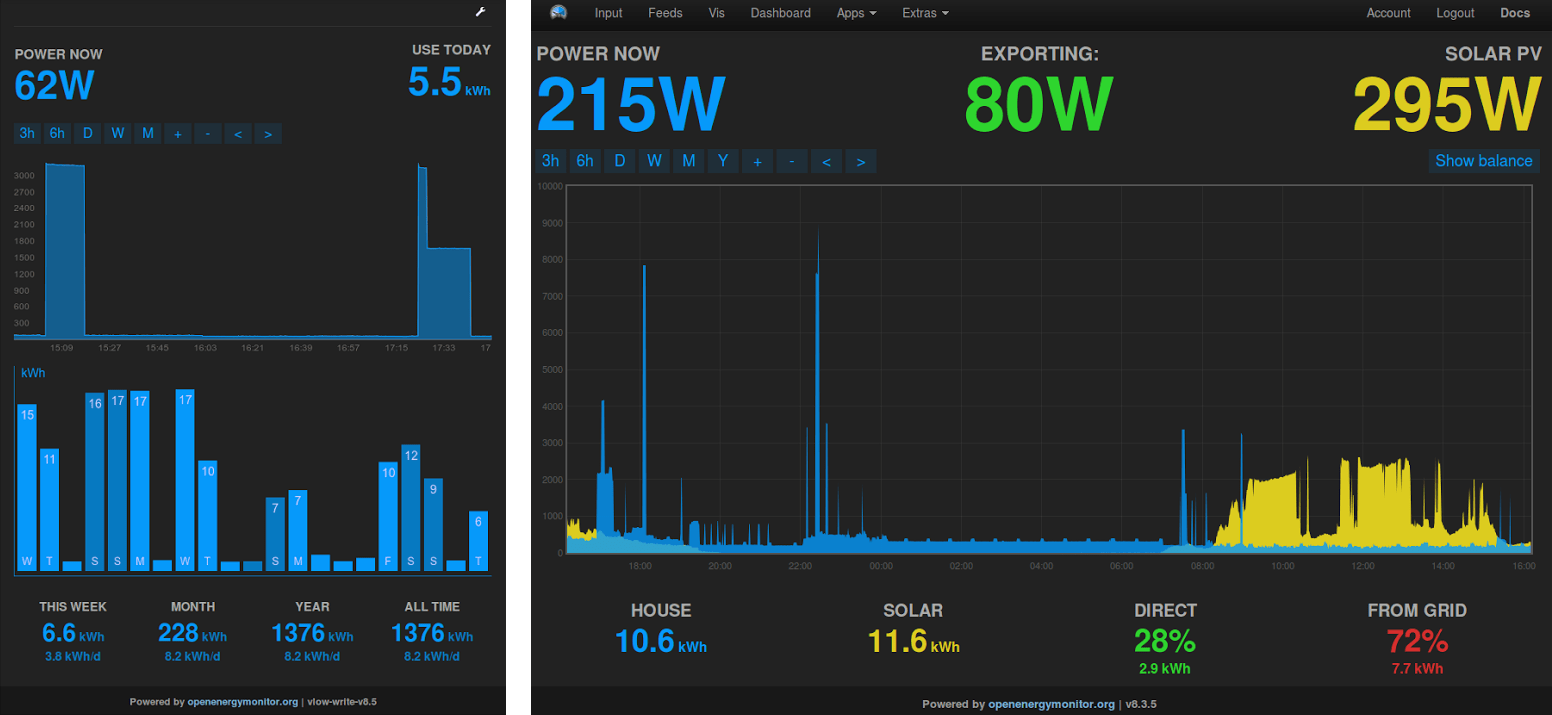
EmonCMS provides a visually appealing and simple user interface for energy analysis. But what about all my other sensor data throughout the house? While I can pull this other data through to EmonCMS for aggregation, I found I couldn’t graph it in the same way. I also found the performance of EmonCMS a little slow.
This got me thinking a bit more. Is there a better set of tools for aggregating all data in a single repository? After all, all data will be fed through Home Assistant, including energy.
Enter InfluxDB and Grafana.
Data storage and analysis
All databases are similar in that they collect data right? Yes, but they are not all created equal. The type of data matters, like temperature data points or energy usage over a period of time. This requires a time-based database for optimal storage and retrieval. These types of databases are increasing in popularity as the number of connected devices and sensors increase. But storage is only half of the equation, and needs to be complemented with a means to view it.
After some research InfluxDB and Grafana rose to the top as the power duo for time-based data storage and analysis.
For testing purposes I configured both services on an old unused laptop, and let it run for 2 weeks. I logged data from my local weather source BOM, two room temperature / humidity sensors, a motion sensor, and a light. I’ll discuss the sensor hardware component in the next part, after my next hardware order arrives.
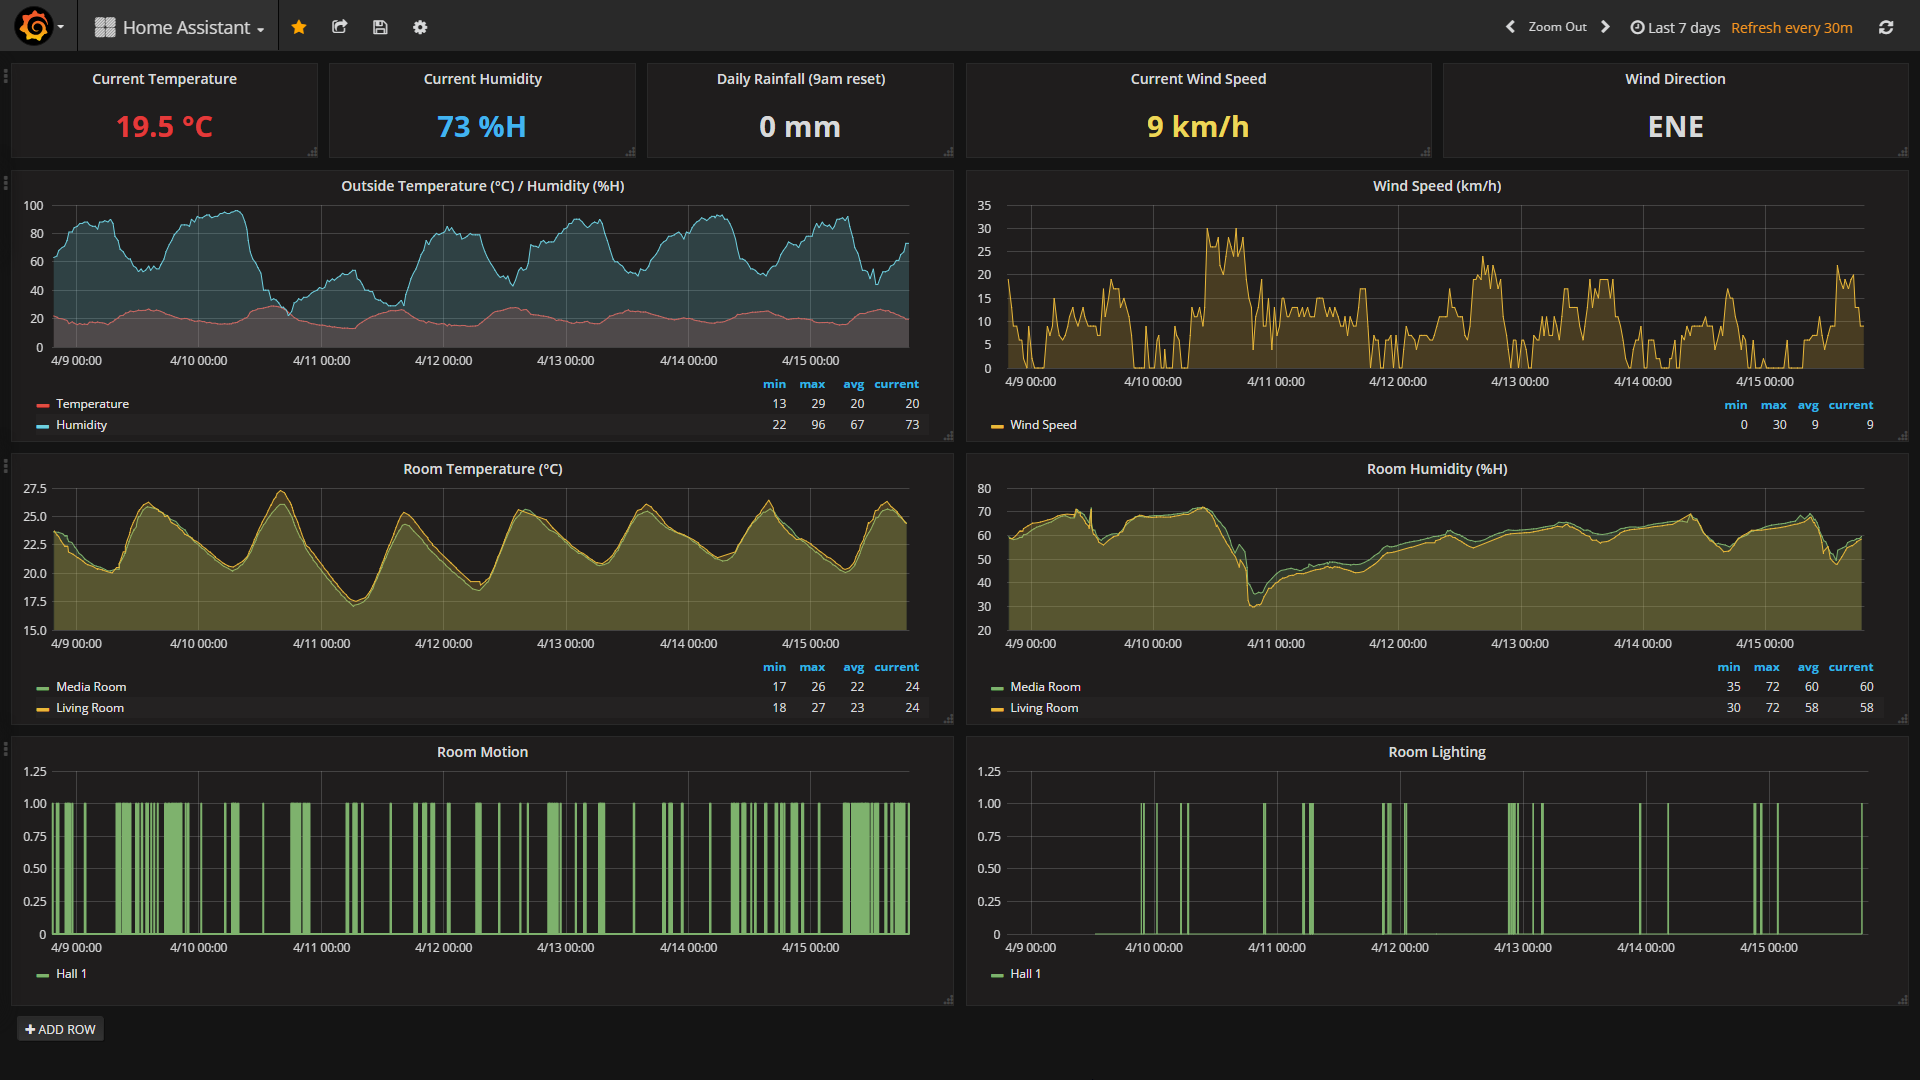
As the image above shows, so far, so good. This new system is proving to be reliable, and fast!
Circling back to a previous point I made on feeding the energy data from EmonCMS into Home Assistant. In theory that now means the energy data can also be sent to InfluxDB, and viewed in Grafana alongside all other data. Nice!
This simplifies the data component into two complimentary services;
InfluxDB stores all the data long term, and uses built-in policy management for retention. e.g. Recent data can be stored at 1 hour intervals, with anything over let’s say a year reducing to daily averages. InfluxDB also has a HTTP API for data querying by other services.
Grafana is simply a front-end interface for viewing the data. It can pull in data from a broad range of sources, allowing me to expand beyond Home Assistant data if need be.
The data component is also distinctly separate from Home Assistant. This means the data component can be changed, updated, or removed without any negative effects to the home automation.
It’s obviously too soon to judge whether this data will be useful, or a nice to have. Graphs provide an easy way to view all data at a glance, or comparatively such as overlaying the temperatures of all rooms.
But contextually, graphs are not that great. The graphed temperatures of rooms do not show where the rooms are in the building, or their orientation to the sun. That is why at some stage throughout this process I would like to connect select data to a BIM. Visually it will be easier to read, but contextually it will make more sense.


